Storm Warnings Infographic

I decided to do the Movie Infographic design assignment.

Untitled Infographic

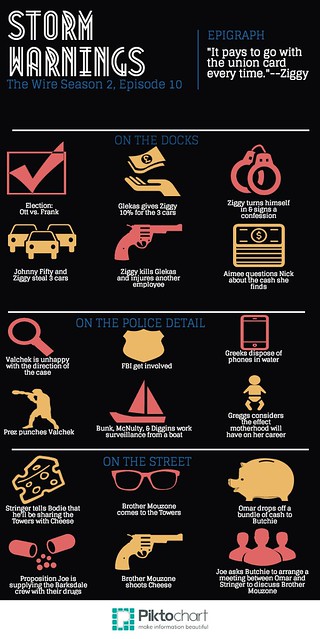
After seeing Meredith’s Infographic, I decided to use Piktochart as well. I really am impressed with all the options and freedom I had with the design. I was really bowled over by episode 10, so I decided to do that one, but I was a bit hazy on all that had happened, so I used this as a reference.

Design-wise, I chose a pretty simple template and then manipulated the lay-out to match what I had in mind. I decided to mimic one of the most common color palettes in the series (blue, red, & yellow), but make them a much lighter hue so they aren’t as abrasive to look at.

Ultimately, I think I summarized and represented a very intense episode pretty well.

A New Spin on a Storyline

For one of my assignments, I decided to make an infograph narrating one of the episodes. I’ve seen a lot of inforgrahs before and they just look so cool! I’ve always wanted to make one. So I said why not! I put Season 2 Episode 1 “Ebb Tide” into an info graphic. It brings a new spin on the story line. (The quality of the image isn’t the greatest and it left some images out. You can find the actual inforgraph here.)

inforgraph2

I decided to do the first episode of the season rather than other episodes because this episode is full of new beginnings. So I thought this would sum up the episode nicely. It also introduces a lot of new characters, which is why I made the character charts. Making the infograph helped me piece together all the different things that went on during the episode. I went through the episode to gather the events into 3 different topics; the port, the law, and the street. I noticed that even though it is a different season, the producers still kept Barksdale’s ring in the plot. It was interesting to see how characters like, Avon, and Dee ended up. There are a number of new characters introduced in this episode especially since there is a whole new case for the season. The season focuses on the Port of Baltimore and some of the Longshoremen. There is Frank, Nick, and Ziggy Sobotka, “Horseface,” and Spiros who are all introduced in this episode. (There are definitely more introduced but these were the ones that stood out to me). Beatrice Russell, an officer for the port police, is the one who finds the case. She opens up a container that has a fake compartment where 13 girls were held, possibly through human trafficking. These girls died on the journey over.

To put this infograph together I took screen shots from different scenes. I then went through and found different head shots for each of the characters. I found this website called Piktochart that allowed me to create the info graph format. I got a lot of inspiration from the default layout. I just let the creative way take over from there. I arranged the different pictures according to where their character fit, and which event fell under the different 3 topics. It was really fun to put together and I really enjoyed this assignment!

Movie Infographic

Create an infographic that visually explores a movie (or a series of movies). Click and zoom in on the featured infographic to the left that explores the Mad Max trilogy. In this example the infographic looks at all the key aspects of these three movies, including their respective box office success, kill count, the price of fuel in the UK, US and Australia at the time of the films’ release, the weaponry used and the iconic vehicles that made the films stand out so much. This brilliant example intrigued me, and I couldn’t resist turning it into a ds106 design assignment.